Usage
Currently the only data endpoint of the api list video usage kpis provides the minimal information to follow the api usage.
4 monthly KPIs are provided:
- Transcoding
- Hosting
- Delivery
- DRM (optional)
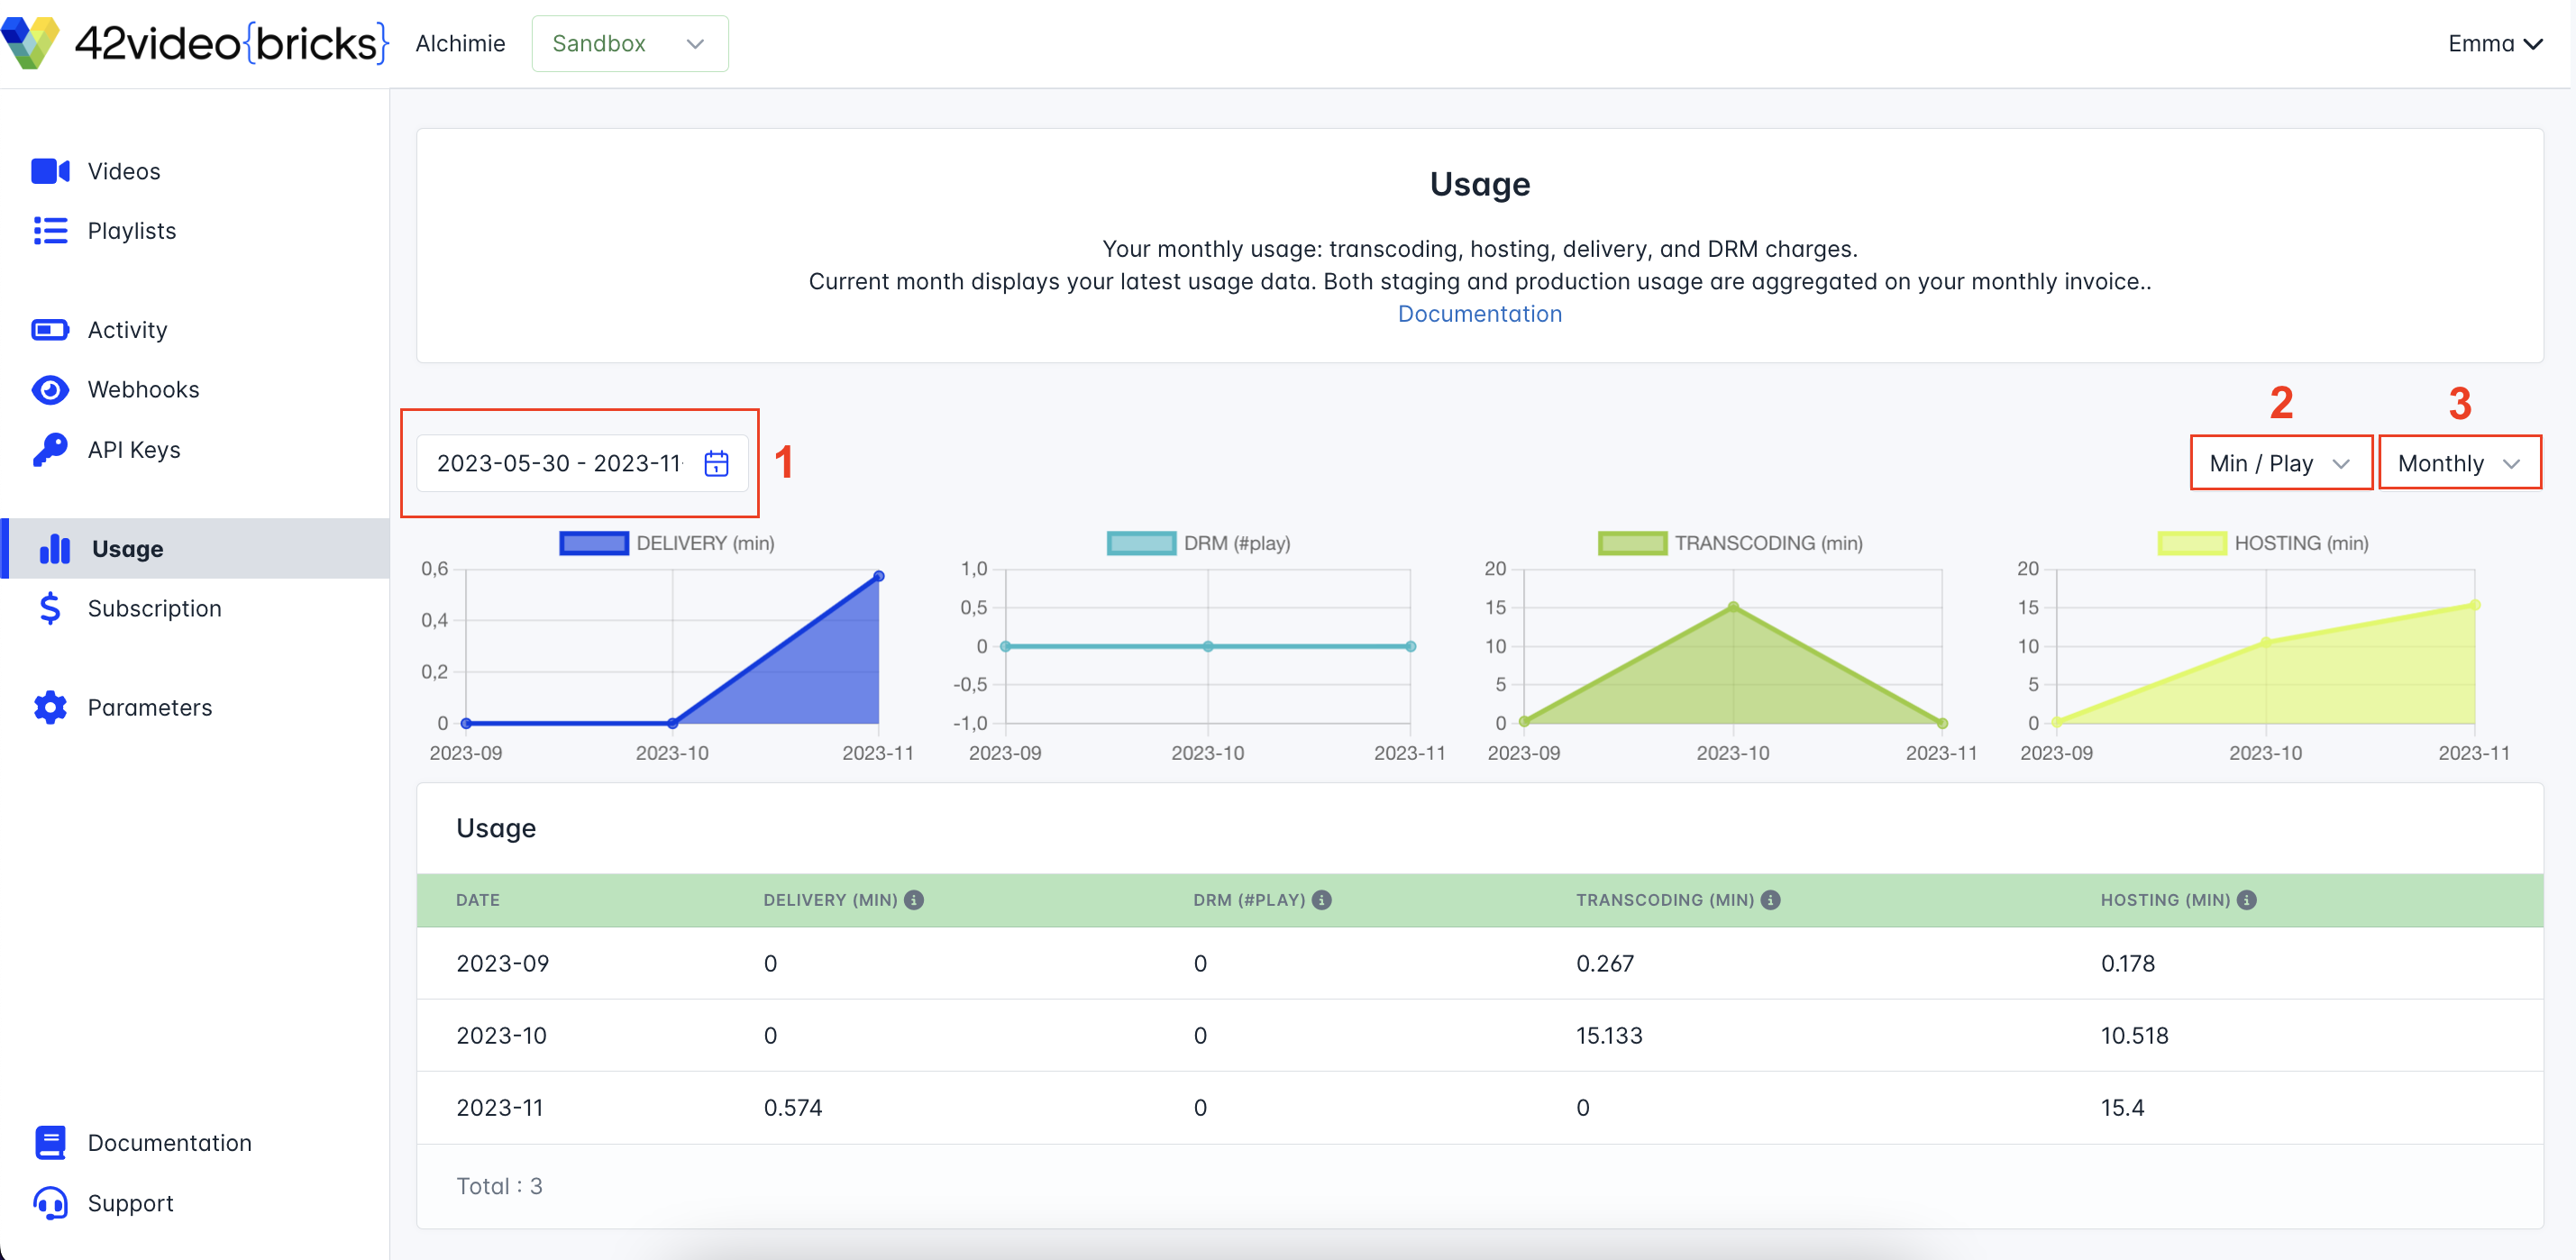
1: You can select a period of time for which you want to see your KPI by using the calendar selector. This is not available on the Sandbox environment. The data showed both staging and production data together.
2: You can select the metric you want to show:
Min/Play: will show the KPIs data in terms of minutes and play
Euro: Only available in a monthly view, it will show your consumption in euros for the differents KPIs
3:You can track these KPIs on different views :
Monthly: It will show you your data consumption for every month
Weekly: It will show you your data consumption for every week
Daily: It will show you your data consumption on a daily basis
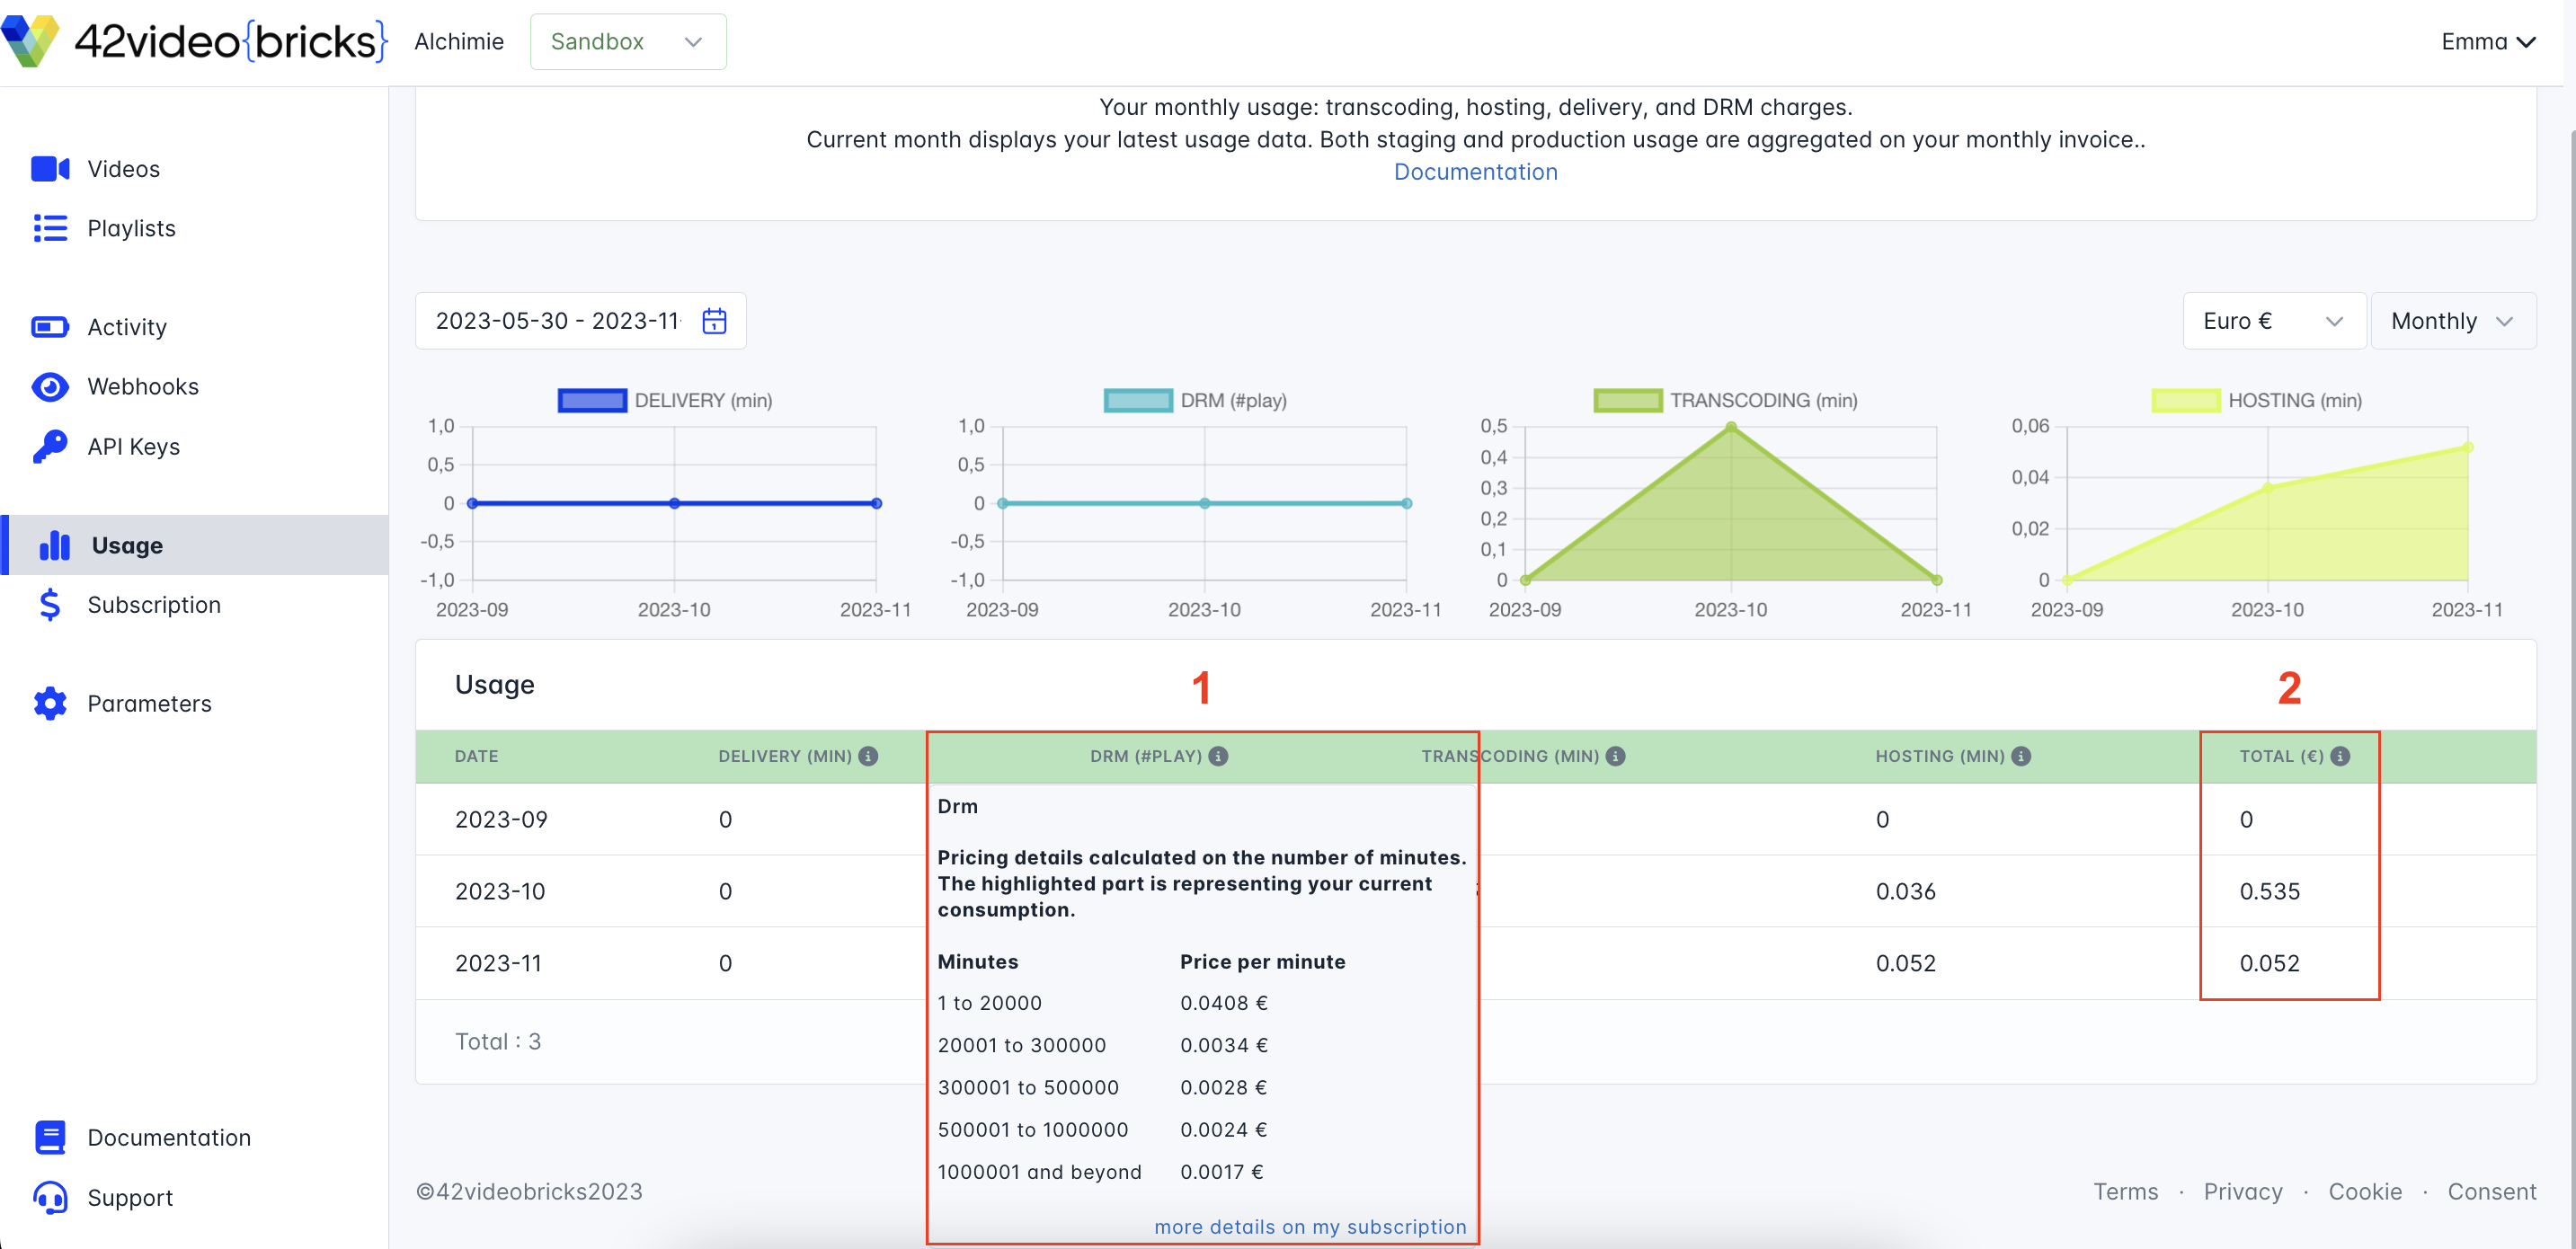
1: When you hover the little information icon next to each of the KPI you will see all the different tariff levels for this KPI. For more information on you subscription, you can directly go to your subscription portal (in the subscription tab)
2: When you’re on the Euro view, you can see the total price of your consumption for the different months.
You can also find more information about pricing.
Updated about 1 year ago